
Opskeet website analytics: what it tracks and how to read it
See visitors, visits, pageviews, sources, pages, countries and devices on your site with Opskeet analytics, and what is and isn't counted.
On this page
Analytics shows who visits your site, where they come from and what they do. It uses the same install code as the chat, so there's nothing extra to add.
Anyone on the team can view it. Owners and admins manage goals, funnels and settings.
Turn it on
Analytics runs once the install code is on your site, even if the launcher is hidden. Switch the module on or off in Settings → Modules. Turning it off stops counting and hides Analytics.
New projects show "No visits yet" until the first visit arrives. If there's none for over a day you see "No visits since…" with a Check install button.
The dashboard
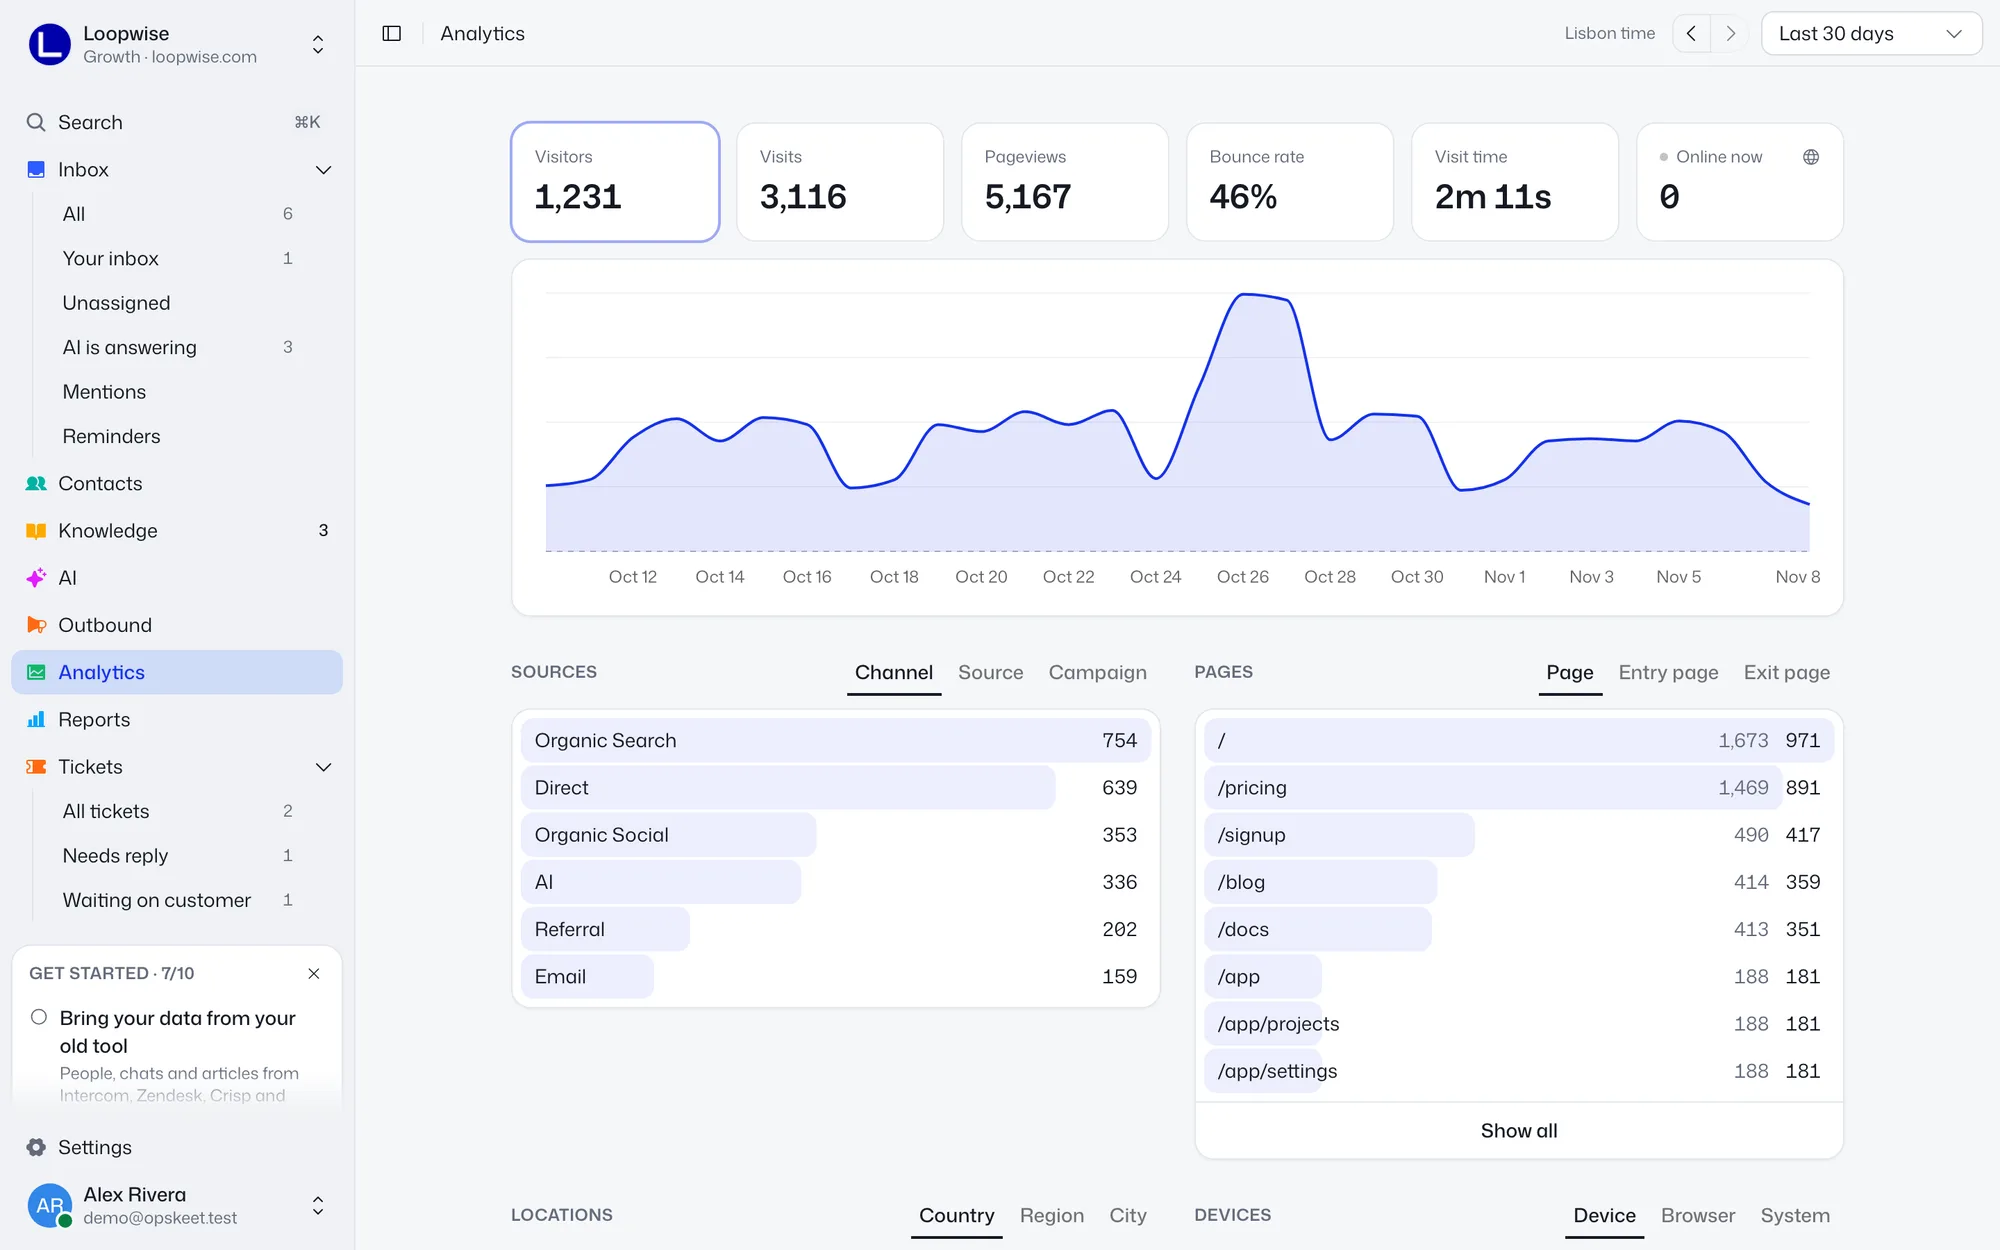
Go to Analytics. The Period menu offers Today, Yesterday, Last 7 days, Last 30 days (default), Last 90 days and Last 12 months. Arrows step to earlier or later periods.
Top cards, each compared with the previous period:
- Visitors
- Visits
- Pageviews
- Bounce rate (lower is better)
- Visit time
- Online now opens Live
Click a card to chart it. Below are lists:
| Card | Tabs |
|---|---|
| Sources | Channel, Source, Campaign |
| Pages | Page, Entry page, Exit page |
| Locations | Country, Region, City |
| Devices | Device, Browser, System |
Click any row to filter everything by it. Filters show as chips with a remove button. The filters are in the address, so Back undoes them.
Channels are Direct, Organic Search, Organic Social, AI (like ChatGPT and Claude), Referral, Email and Paid.
Time zone
Days start at midnight in your project's time zone, shown at the top right. Change it in Settings → Business hours → Time zone or under Visitors in Settings → Analytics.
What's tracked
- Page views, including page changes in single-page apps. The address without its query, except campaign tags like
utm_source,refandgclid. - Time on page.
- Clicks to other sites (Outbound link), Download links such as PDF and zip, Chat started, Request sent and Article read.
- Your own events: Track events.
Country, region and city come from the visitor's network, with coordinates rounded to about 10 km. Data is kept for 25 months.
What's not counted
- Bots and automated browsers.
- Teammates who are signed in on your site.
- Any browser where you opened the link under Settings → Analytics → Your own visits → Don't count this browser. Do it once in each browser.
Pages that start chats
With Support on, this card shows pages where many visitors start a chat, with a flag like "3× usual". Write an article and Greet here help you fix the cause.
Settings
Go to Settings → Analytics for the module switch, your own visits, the share link, privacy options and Pages to watch. Pages to watch takes one page per line, like /pricing. When someone you know opens one, it shows in their activity, at most once a day per page.
Weekly email
Each teammate can get a Monday summary: visitors, top sources and pages, and goals. Turn on Weekly analytics in Settings → Notifications. It's sent at 9 in the project's time zone, and not sent for a quiet week.
Numbers look low?
- Ad blockers can block the analytics script. The chat still works.
- Bots and your own team are left out.
- With remembering off, the same person on different days counts again.
Did this help?
Related articles
- AI report: how many chats the AI solvesSee how many chats the AI agent answered, solved or handed over, why it handed over, and the questions it couldn't answer.
- Build a conversion funnel in Opskeet analyticsChain pages and events into a funnel to see how many visitors complete each step of sign-up, checkout or any journey.
- Set up goals in Opskeet analyticsTrack sign-ups, purchases and other conversions as goals, from a page visit or an event, and see how many visitors reach them.
- See who's on your website right now with Live viewWatch visitors on a live map or globe in Opskeet, see their pages and location, and start a chat with people you already know.
- "Analytics privacy: cookies, returning visitors and GPC"Choose whether Opskeet analytics remembers returning visitors, what's stored in the browser, how Global Privacy Control is handled, and what session recordings keep.